The True Cost of Waiting
Data pulled September 5, 2026 · next update October 2026 · 6 min read
"I'll buy when rates come down" is the most common plan in American housing right now. For the last twelve months it has also been a plan that lost money nearly every time it was tried — and the one window in which it paid has already closed. Here is the arithmetic, from public data, with our assumptions written out so you can change them.
The 30-second answers
- $77 a month. That is what waiting twelve months cost the buyer of a median-priced home: the same house, bought in September 2025 at 6.50% versus bought today at 6.71%. Over a 30-year loan that is $27,600 in extra payments, $22,700 of it pure interest.
- 35 basis points. Mortgage rates would have to fall to 6.36% before a buyer today pays the same monthly amount a buyer paid a year ago. That is the breakeven on the whole "wait for the cut" strategy.
- $30,800 of house. At a $2,000/month principal-and-interest budget, buying power has shrunk that much since the 5.98% low in February. Since July 2 alone: $11,400.
- $205,000. What a five-year delay costs a $500/month investor at a 7% average return, measured at the 30-year mark from the first payment — closing the gap takes $753/month, not $500.
Cite this page: TrueCostCalc, "The True Cost of Waiting," September 2026, truecostcalc.com/true-cost-of-waiting.html.
Finding 1: the rate cut came in February, and the window has closed
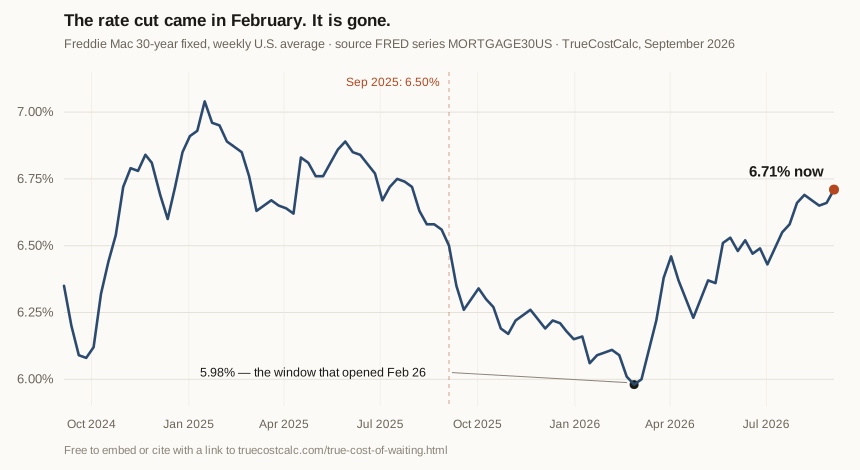
The 30-year fixed mortgage rate averaged 6.71% in the week ending September 3, 2026 (Freddie Mac, via FRED). A year earlier it was 6.50%. It did fall this year — bottoming at 5.98% in the week of February 26 — and has climbed 73 basis points since, including 28 points since July 2. Anyone who saw February's rate and thought "it should go lower" is now paying more than they would have at 6.50% last autumn.
That is the whole problem with waiting: the rate you can get is observable today, and the rate you are waiting for is not.
Finding 2: while you waited, the house got more expensive
Prices did not sit still while buyers waited for rates. The S&P CoreLogic Case-Shiller U.S. National Home Price Index rose 1.53% in the twelve months to June 2026 (index 336.7 vs 331.6). Over five years the same index compounds to 5.21% a year — which is why the "prices are about to crash" wait has historically been the expensive one.
On the median home sold — $410,700 (Census/HUD, most recent quarter) — a 1.53% year means about $6,200 of extra price on the same house.
An honest note on the two price measures, because they disagree: the Census median sales price actually fell 1.3% year over year, while the Case-Shiller repeat-sale index rose 1.5%. Both are true. The median sales price moves with which homes happen to trade (a shift toward smaller houses pulls it down); the repeat-sale index tracks the same houses being sold twice, so it is the better measure of what waiting does to a specific home you are looking at. We use it. Many articles comparing "home prices fell" and "home prices rose" in the same month are quoting different one of these two series without saying so.
What waiting has cost, by how long you wait
Model: one house, 20% down, 30-year fixed. "Buy then" is the price of that same house at its index-implied value a year before, at the rate that was actually on offer that week.
| You bought instead in… | Rate | Home price | Payment |
|---|---|---|---|
| Sept 2021 (5 years of waiting) | 2.87% | $318,500 | $1,057/mo |
| Sept 2023 (3 years of waiting) | 7.12% | $376,100 | $2,026/mo |
| Sept 2025 (1 year of waiting) | 6.50% | $404,500 | $2,046/mo |
| Feb 2026 (the 5.98% window) | 5.98% | $407,600 | $1,951/mo |
| Today (Sept 2026) | 6.71% | $410,700 | $2,122/mo |
Twelve months of waiting cost +$77/month and +$22,700 in interest over the loan. Waiting since February — since the best rate of the year — costs +$171/month and +$59,300 in interest. Sixty months of it costs +$1,066/month: a doubling of the payment on the same four walls.
Finding 3: the breakeven — how big a cut has to be before waiting pays
This is the number we would actually use to decide. Holding the house constant, the rate on today's price must fall to 6.36% for the monthly payment to match what was available in September 2025. A 35-point move is not fantasy — but it is not the small, obvious dip most waiters are picturing, and it has to happen before the price runs further.
The grid below is the honest version of the bet: change in your monthly payment if you wait 12 months, at each combination of a rate cut and a price trend.
| If rates fall… | Prices flat | +1.5% (last yr) | +3.0% | +5.2% (5-yr avg) |
|---|---|---|---|---|
| No cut (6.71%) | $0 | +$32 | +$64 | +$111 |
| −0.25% (6.46%) | −$54 | −$23 | +$8 | +$54 |
| −0.50% (6.21%) | −$108 | −$77 | −$47 | −$3 |
| −0.75% (5.96%) | −$161 | −$131 | −$102 | −$59 |
| −1.00% (5.71%) | −$213 | −$184 | −$156 | −$114 |
Read it this way: a quarter-point cut is not enough to beat twelve months of ordinary price growth. You need roughly a half-point, arriving inside the year, before waiting is the better payment — and every cell above still ignores the rent you pay while waiting, which makes waiting worse than this table looks.
Finding 4: what the rate is doing to your buying power right now
At a fixed $2,000/month principal-and-interest budget with 20% down:
- at 5.98% (Feb 26, 2026): a $417,900 home
- at 6.43% (July 2, 2026): a $398,400 home
- at 6.71% (today): a $387,000 home
- at 7.00%: a $375,800 home
Seven months of rate drift moved the needle $30,800 of house — and $11,400 of that is just since July. That is the number to quote when someone says a quarter point does not matter: at this budget, a quarter point is roughly eleven thousand dollars of home.
Finding 5: waiting costs more outside of housing, and it is more predictable
Housing depends on forecasts. Compounding does not — the same delay logic, applied to $500/month invested at a 7% average return, over a 30-year horizon:
| You start investing after… | Balance at year 30 | Cost of the wait |
|---|---|---|
| 0 years (today) | $610,000 | — |
| 1 year | $563,100 | $46,900 |
| 3 years | $478,600 | $131,400 |
| 5 years | $405,000 | $205,000 |
| 10 years | $260,500 | $349,500 |
Notice what the first row costs: one year of "next year" is $46,900, in exchange for twelve $500 payments you would never have remembered making. Recovering a five-year delay is not a discipline problem, it is arithmetic: $753/month across the years you have left, half again as much.
Debt is the same mechanism running in reverse: a year of not attacking a card balance is a year of the balance attacking you. Put your own APR into the credit-card payoff calculator and it will show you the number for your statement tonight.
How this was calculated
- Rates: Freddie Mac 30-year fixed weekly U.S. average, 6.71% for the week ending Sept 3, 2026; 6.50% for Sept 4, 2025; 7.12% Sept 7, 2023; 2.87% Sept 2, 2021. Series MORTGAGE30US via FRED.
- Prices: S&P CoreLogic Case-Shiller U.S. National Home Price Index, NSA — 336.663 (June 2026) vs 331.605 (June 2025). Series CSUSHPINSA. Price levels: Census/HUD median sales price of single-family homes sold, MSPUS, $410,700 (April 2026).
- Payment math: standard amortizing loan, monthly compounding, 360 payments, 80% loan-to-value (20% down), principal and interest only.
- Investing math: $500 at the end of each month, 7% nominal annually, monthly compounding, value compared at the 30-year mark.
- Excluded, deliberately: property taxes, insurance, PMI, closing costs, maintenance, and any rent paid during the waiting period. Those are all real and all work against waiting. Nothing here is tax or investment advice.
- One distinction we keep straight: a higher monthly payment times 360 is not all cost. On the twelve-month comparison the extra $27,640 in payments is $22,706 of extra interest plus $4,936 of extra principal — the principal half is equity you own, not money burned. We quote the interest figure.
💡 See what your actual payment would be
Enter your price, down payment and offer rate — the calculator returns the payment and lifetime interest in one step.
Free mortgage calculator →Run your own version
Every number above is a template. Mortgage and loan payment for the purchase itself, compound interest and investment return for the investing side, retirement for the horizon that decides how many years of waiting you can actually afford.
Related
How Much House Can I Afford? | Compound Interest, Explained With Real Numbers | Pay Off Debt or Invest?
🏠 Real Estate Investment Analyzer Bundle — $49
Timing a purchase is only half the decision; whether this property is the right one is the other. The workbook gives you cap rate, monthly cash flow, house-hacking math and 5-year projections — in Excel or Google Sheets. One-time $49, instant download, 30-day money-back guarantee.
See what's inside →Embed or cite this data
Journalists, bloggers and newsletter writers: the figures on this page are free to use with attribution and a link. Suggested citation — TrueCostCalc, "The True Cost of Waiting," September 2026. Method notes and the raw series are listed above so you can check every number.
This page is for information only and is not financial, tax or investment advice. Rates and prices change weekly; check the underlying series for the current reading. Projections assume constant returns and no fees or taxes.